
@sferralove/agentflowLive trace & observability for OpenCode agent workflows — plugin, server, and dashboard
1
81
近 7 天 11
28.7
生态多维模型
3 个月前
2026-05-07
快速安装与配置
opencode.json写入当前项目的 opencode.json,只对这个仓库生效。
opencode.json
{
  "$schema": "https://opencode.ai/config.json",
  "plugin": ["@sferralove/agentflow@3.1.1"]
}
写入 ~/.config/opencode/opencode.json,对所有项目生效。
~/.config/opencode/opencode.json
{
  "$schema": "https://opencode.ai/config.json",
  "plugin": ["@sferralove/agentflow@3.1.1"]
}
若你要在本地改造这个插件,先装到项目里再从本地路径引用。
shell
pnpm add -D @sferralove/agentflowopencode 启动时会通过内嵌运行时自动加载 npm 依赖并缓存至本地目录,无需手动在全局环境执行安装。
AgentFlow
Live trace & monitor for AI agent orchestration


AgentFlow is a lightweight observability layer for OpenCode agent workflows. It captures every tool invocation — task delegations, file edits, shell commands — and surfaces a real-time, structured trace through a browser dashboard.
No database. No external services. One Bun process, file-based storage, live SSE streaming.
Why AgentFlow?
When running multi-agent OpenCode sessions, understanding what happened and why becomes critical. AgentFlow answers:
- What did each agent do? — Hierarchical task tree of every invocation
- How long did it take? — Chronological timeline with durations
- Who delegated to whom? — Agent dependency graph with critical path analysis
- What evidence supports each step? — Raw inputs, outputs, and errors per trace node
Features
- ⚡ Real-time capture — Zero-dependency OpenCode plugin writes every tool event (task, bash, write, edit) to append-only JSONL files as they execute
- 🔄 Live SSE streaming — Two modes: raw event firehose by session, or typed
PatchEnvelopeevents by run with sequence-based replay (after=N) - 🌳 Trace engine — In-process pipeline normalizes raw events into structured
RunSnapshotrecords: a task tree (TraceNode[]), a chronological log (TimelineItem[]), and an agent dependency graph (SessionGraph) - 📊 Dashboard UI — React 18 + ReactFlow + Tailwind with three panels: Work Trace (tree/graph toggle), Evidence Panel, and Timeline
- 🧩 Critical path analysis — Computes the longest-duration chain through the agent graph, highlighting bottlenecks
- 🔌 Zero external dependencies — Bun native HTTP, no Express, no Redis, no Postgres. Everything is file-based (JSONL + JSON snapshots)
- 📁 File-based persistence — Runs, snapshots, and patches stored as plain JSON/JSONL in
.agentflow/runs/. Raw events are always the source of truth
Quick Start
# Install
npm install @sferralove/agentflow

# Initialize — creates .agentflow/ + copies plugin to OpenCode
npx agentflow init

# Build TypeScript + dashboard
npm run build

# Start server (default :3001)
npx agentflow serve

# Open the dashboard
open http://localhost:3001
With the plugin enabled in OpenCode, every agent session emits events that appear live on the dashboard — no configuration required.
Requirements
- Bun ≥ 1.2.0 (required runtime — Node.js is not supported)
- OpenCode ≥ 1.x (for plugin integration)
- npm (for dashboard build)
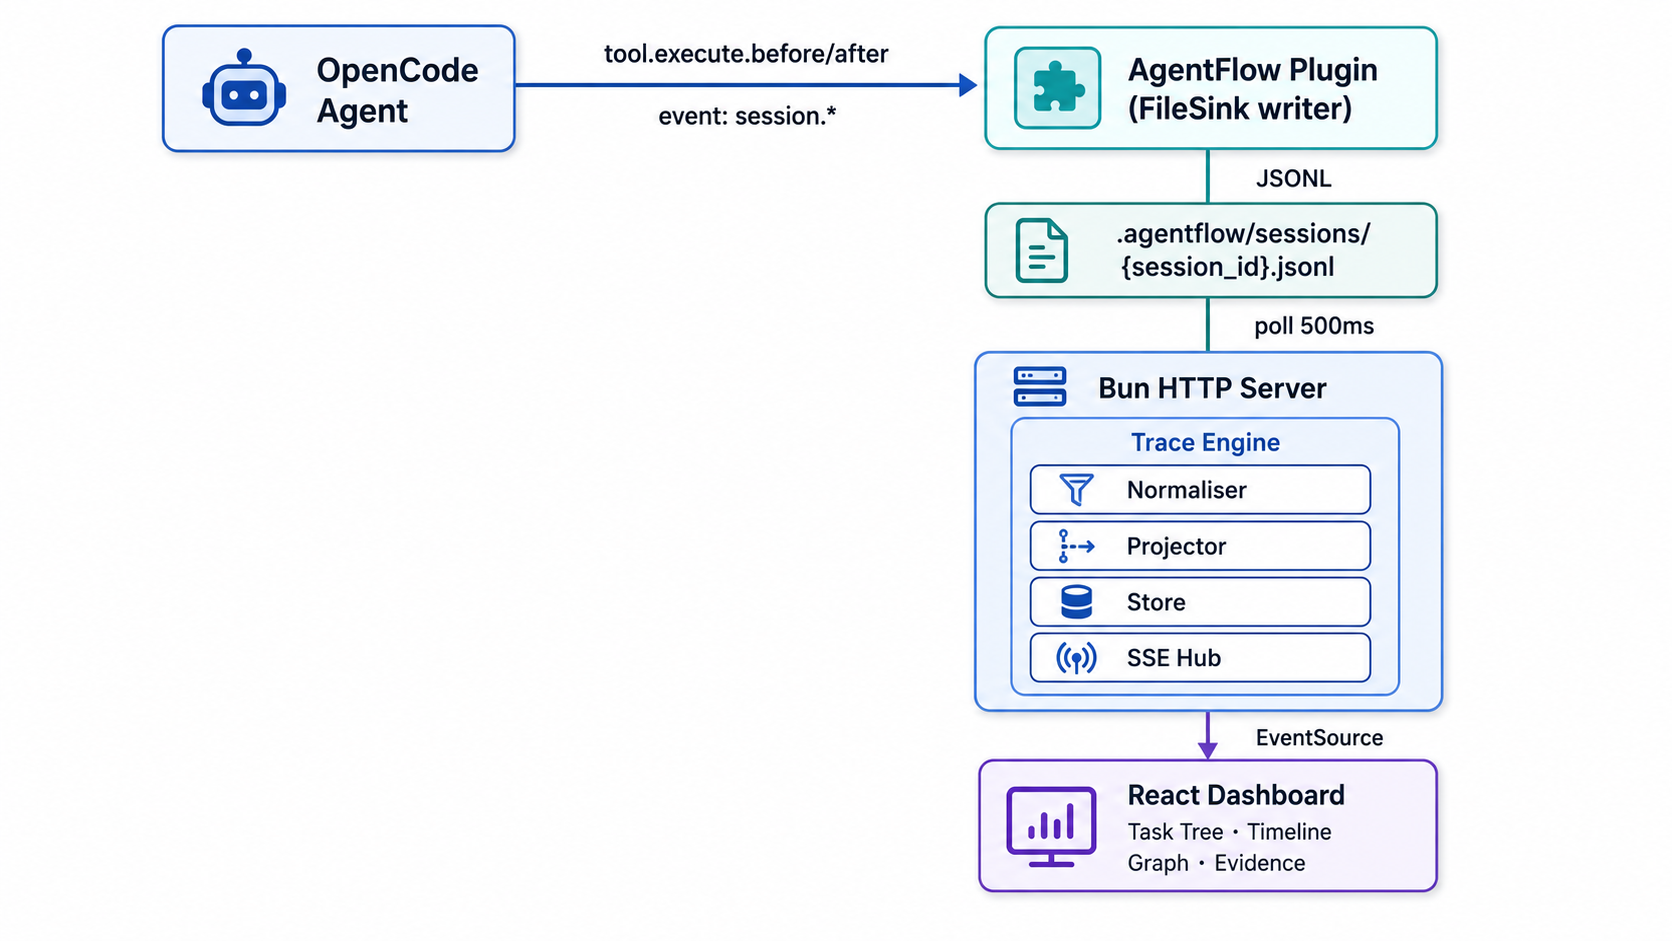
Architecture
The dashboard renders the trace engine output: hierarchical task tree (left), evidence panel (right), and chronological timeline (bottom).
| Layer | Responsibility |
|---|---|
| Event normalizer | Classifies each raw AgentEvent into a semantic NormalizedEventKind (e.g. delegation.started, command.executed, file.changed) |
| Trace projector | Incrementally builds a RunSnapshot — trace nodes, timeline items, and the agent graph — from the event stream. Deduplication is handled by event ID |
| Run store | Persists snapshots and patch history to .agentflow/runs/{runId}/ as plain JSON/JSONL files |
| SSE hub | Maintains an in-memory patch history per run and registers connected clients. Replays missed patches on connect via the after=N cursor |
All four layers run in-process with zero additional dependencies. Persistence is fire-and-forget; the event pipeline never blocks.
CLI
| Command | Description |
|---|---|
agentflow init |
Initialize .agentflow/ directories and copy the OpenCode plugin |
agentflow serve [port] |
Start the Bun HTTP server (default: 3001) |
agentflow stop |
Gracefully stop the running server via PID file |
agentflow status |
Check if the server is running or stopped |
API
Run-first endpoints (v1)
GET /health
Health check. Returns server status, connected SSE clients, and tracked sessions.
{ "status": "ok", "clients": 2, "sessions": 1 }
GET /api/runs/current
Full RunSnapshot from the in-memory projector — trace nodes, timeline, graph, raw events.
{
  "run": { "id": "run_session_1", "status": "running", ... },
  "traceNodes": [...],
  "timelineItems": [...],
  "graph": { "nodes": [...], "edges": [...] },
  "rawEvents": [...]
}
GET /api/runs
List of active runs.
{ "runs": [{ "id": "run_session_1", "status": "running", ... }] }
GET /api/runs/:runId/snapshot
Persisted RunSnapshot for a specific run ID, loaded from disk.
GET /api/stream?run=current&after=0
SSE stream of typed PatchEnvelope events. Named SSE events per patch type:
| Event Name | Payload | Trigger |
|---|---|---|
raw.event |
AgentEvent |
Every raw event ingested |
trace.node.upserted |
TraceNode |
Node created or status changed |
trace.node.completed |
TraceNode |
Node reaches completed/failed |
timeline.item.upserted |
TimelineItem |
Timeline entry added |
graph.node.upserted |
AgentNode |
Graph node created or updated |
graph.edge.upserted |
AgentEdge |
Graph edge created |
run.updated |
Run |
Run metadata changed |
event: trace.node.upserted
id: 3
data: {"id":"patch_3","runId":"run_session_1","sequence":3,"type":"trace.node.upserted","payload":{...}}
Legacy endpoints (pre-v1)
| Endpoint | Description |
|---|---|
GET /api/stream?session=X |
SSE stream of raw JSONL events for a session |
GET /api/events?session=X&since=TS&tree=true |
JSON events (all sessions when tree=true) |
GET /api/agents/X?tree=true |
Agent graph with nodes and edges |
GET /api/sessions |
List of available sessions |
Dashboard
The dashboard provides three integrated panels:
- Work Trace — Hierarchical task tree of trace nodes. Each node shows status, kind, confidence, and evidence count. Toggle to AgentGraph view for the ReactFlow dependency graph with critical path highlighting.
- Evidence Panel — Select a trace node to inspect its backing raw events: inputs, outputs, errors, and timestamps.
- Timeline — Chronological log of all events. Click any entry to jump to the corresponding trace node.
Development mode
# Vite HMR dev server on :3000
npm -C dashboard run dev

# API server on :3001 (separate terminal)
npx agentflow serve 3001
Development
npm run build          # TypeScript + dashboard (order matters)
npm test               # Full test suite (bun:test)
npx tsc --noEmit       # TypeScript check only
Project structure
src/
  cli.ts, plugin.ts, server.ts, types.ts, index.ts
  trace/             # Trace engine (normalizer, projector, graph builder)
  run/               # Persistence (run store)
  stream/            # SSE delivery (hub)
dashboard/
  src/hooks/          # useRunTrace, useSSE
  src/components/     # AgentGraph, TraceTree, TraceEvidencePanel, TraceTimeline, Header ...
  src/utils/          # Critical path computation, timeline filtering
test/                 # 10 test files (bun:test)
License
MIT